
Installing Elastic Cloud on Kubernetes (ECK) on k3s
See this guide on getting k3s setup on Proxmox.
Install ECK
- Install ECK Operator
- Add Elastic Helm repo
helm repo add elastic https://helm.elastic.co helm repo update - Install ECK Operator
helm install elastic-operator elastic/eck-operator -n elastic-system --create-namespace
- Add Elastic Helm repo
- Install ECK
- Using the
eck-stackHelm Chart - We don’t need 3 nodes, so let’s reduce it to 2 with the
--setcommand - Reference: ECK Helm Docs
# Download the files # Elasticsearch, Kibana with Fleet Server and Agent wget https://raw.githubusercontent.com/elastic/cloud-on-k8s/2.16/deploy/eck-stack/examples/agent/fleet-agents.yaml # Logstash and Beats wget https://raw.githubusercontent.com/elastic/cloud-on-k8s/2.16/deploy/eck-stack/examples/logstash/basic-eck.yaml # Edit basic-eck.yaml to remove the daemonSet field from the beats configuration sed -i '/daemonSet: null/d' basic-eck.yaml # Install with modified files helm install elastic-stack elastic/eck-stack -n elastic-stack --create-namespace \ --values fleet-agents.yaml \ --values basic-eck.yaml \ --set eck-elasticsearch.nodeSets[0].count=2- Check the status of installed resources:
kubectl get elasticsearch,kibana,logstash,beats,agents -n elastic-stack
- Using the
If you bork things up, you can get back to this step by uninstalling elastic-stack with helm uninstall:
helm uninstall elastic-stack -n elastic-stack
Access Elastic Stack Services - Ingress
- Reference: ECK Services Docs
- Kibana IngressRoute
- Find out Kibana Service Name
elastic@elastic:~/k8s-configs/elastic$ kubectl get svc -n elastic-stack | grep kibana kibana-kb-http ClusterIP 10.43.242.204 <none> 5601/TCP 18m -
Create
kibana-ingress.yaml, with the proper service name and the desired hostname for Kibana, and applyapiVersion: traefik.containo.us/v1alpha1 kind: ServersTransport metadata: name: kibana-transport namespace: elastic-stack spec: insecureSkipVerify: true # Only use in dev environments --- apiVersion: traefik.containo.us/v1alpha1 kind: IngressRoute metadata: name: kibana-ingressroute namespace: elastic-stack spec: entryPoints: - websecure routes: - kind: Rule match: Host(`kibana.k8s.<YOUR DOMAIN>`) services: - name: elastic-stack-eck-kibana-kb-http port: 5601 scheme: https serversTransport: kibana-transportk apply -f kibana-ingress.yaml -
Retrieve the user
elasticpasswordkubectl get secret -n elastic-stack elasticsearch-es-elastic-user -o go-template='' && echo - Log in to Kibana
- If you get a warning about
server.publicBaseUrl, you can set that using kubectl.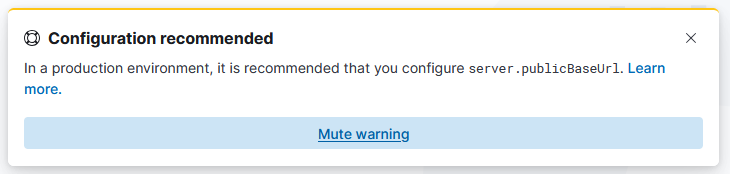
- Fix:
-
Edit the kibana configuration and add the baseUrl:
kubectl edit kibana -n elastic-stack... spec: config: server.publicBaseUrl: <put your kibana base url here> ... -
Confirm that the changes have applied
kubectl get secret -n elastic-stack kibana-kb-config -o jsonpath='{.data.kibana\.yml}' | base64 --decode | grep -i publicBaseUrl publicBaseUrl: <your public base url>-
Check that the popup goes away. If it’s still there, double check that the new kibana pod has started - it may still be in the middle of migrating to the new pod:
k get pods -n elastic-stack -l common.k8s.elastic.co/type=kibana
-
-
- If you get a warning about
- View your Kubernetes Cluster Dashboard
- Go to Dashboards and search for
kubernetes overview - You should see a view populated with data about your kubernetes cluster
- Go to Dashboards and search for
- Find out Kibana Service Name
-
ElasticSearch IngressRoute
-
Get the ElasticSearch service name
$ kubectl get svc -n elastic-stack | grep elasticsearch elasticsearch-es-default ClusterIP None <none> 9200/TCP 14d elasticsearch-es-http ClusterIP 10.43.111.58 <none> 9200/TCP 14d elasticsearch-es-internal-http ClusterIP 10.43.243.106 <none> 9200/TCP 14d elasticsearch-es-transport ClusterIP None <none> 9300/TCP 14d- We’ll use
elasticsearch-es-http
- We’ll use
-
Create and apply
elasticsearch-ingress.yaml:apiVersion: traefik.containo.us/v1alpha1 kind: ServersTransport metadata: name: elasticsearch-transport namespace: elastic-stack spec: insecureSkipVerify: true # Only for dev environments --- apiVersion: traefik.containo.us/v1alpha1 kind: IngressRoute metadata: name: elasticsearch-ingressroute namespace: elastic-stack spec: entryPoints: - websecure routes: - kind: Rule match: Host(`es.k8s.<YOUR DOMAIN>`) services: - name: elasticsearch-es-http port: 9200 scheme: https serversTransport: elasticsearch-transportk apply -f elasticsearch-ingress.yaml -
Test ElasticSearch IngressRoute
  curl -k -I https://es.k8s.<YOUR DOMAIN>
  HTTP/1.1 401 Unauthorized
  Content-Length: 461
  Content-Type: application/json
  Www-Authenticate: Basic realm="security", charset="UTF-8"
  Www-Authenticate: Bearer realm="security"
  Www-Authenticate: ApiKey
  Date: Tue, 20 May 2025 12:03:27 GMT

  curl -k -u "elastic:<password from above>" https://es.k8s.<YOUR DOMAIN>
  {
  "name" : "elasticsearch-es-default-0",
  "cluster_name" : "elasticsearch",
  "cluster_uuid" : "MxHdup56Ry2NtE8GEp2LJw",
  "version" : {
      "number" : "8.17.0",
      "build_flavor" : "default",
      "build_type" : "docker",
      "build_hash" : "2b6a7fed44faa321997703718f07ee0420804b41",
      "build_date" : "2024-12-11T12:08:05.663969764Z",
      "build_snapshot" : false,
      "lucene_version" : "9.12.0",
      "minimum_wire_compatibility_version" : "7.17.0",
      "minimum_index_compatibility_version" : "7.0.0"
  },
  "tagline" : "You Know, for Search"
  }
-
-
Fleet Server IngressRoute
- Confirm the Fleet Server and Elastic ECK Agent are running
- Log into Kibana
- Navigate to Management -> Fleet
- Confirm that
Elastic Agent on ECKandFleet Server on ECKare bothHealthy -
You can also confirm from k8s:
  $ kubectl get agent -n elastic-stack
  NAME                      HEALTH   AVAILABLE   EXPECTED   VERSION   AGE
  elastic-stack-eck-agent   green    1           1          8.17.0    14d
  fleet-server              green    1           1          8.17.0    14d
-
Get the Fleet Server service name
kubectl get svc -n elastic-stack | grep fleet fleet-server-agent-http ClusterIP 10.43.xx.xx <none> 8220/TCP xxm -
Create and apply
fleet-ingress.yamlapiVersion: traefik.containo.us/v1alpha1 kind: ServersTransport metadata: name: fleet-transport namespace: elastic-stack spec: insecureSkipVerify: true # Only for dev environments --- apiVersion: traefik.containo.us/v1alpha1 kind: IngressRoute metadata: name: fleet-ingressroute namespace: elastic-stack spec: entryPoints: - websecure routes: - kind: Rule match: Host(`fleet.k8s.<YOUR DOMAIN>`) services: - name: fleet-server-agent-http port: 8220 scheme: https serversTransport: fleet-transportkubectl apply -f fleet-ingress.yaml -
Test ingress
curl -k -u "elastic:<password from above>" https://fleet.k8s.<YOUR DOMAIN>/api/status {"name":"fleet-server","status":"HEALTHY"} - Update Fleet Settings to use new Ingress
- Because we’re using the ECK operator, we need to make these changes in k8s rather than the GUI (Management -> Fleet -> Settings)
kubectl edit kibana -n elastic-stack- Update the two values:
-
Old
xpack.fleet.agents.elasticsearch.hosts: - https://elasticsearch-es-http.elastic-stack.svc:9200 xpack.fleet.agents.fleet_server.hosts: - https://fleet-server-agent-http.elastic-stack.svc:8220 -
New
      xpack.fleet.agents.elasticsearch.hosts:
      - https://es.k8s.<YOUR DOMAIN>
      - https://elasticsearch-es-http.elastic-stack.svc:9200
      xpack.fleet.agents.fleet_server.hosts:
      - https://fleet.k8s.<YOUR DOMAIN>
      - https://fleet-server-agent-http.elastic-stack.svc:8220
-
-
Watch and wait while the pod restarts:
kubectl get pods -n elastic-stack -l common.k8s.elastic.co/type=kibana -w - Once the restart has occurred, verify in Kibana (Management -> Fleet -> Settings)
- Confirm the Fleet Server and Elastic ECK Agent are running
ECK Integrations
Agents
Deploying agents via Kibana should work as they will deploy with the proper ingress endpoints referenced.
Troubleshooting
untolerated taint {node.kubernetes.io/disk-pressure: }- This means Kubernetes has detected low disk space and applied a taint to prevent new pods from scheduling.
-
Check node disk space
kubectl describe nodes- Look for the
Conditionssection - you’ll likely seeDiskPressure: True.
- Look for the
- Run
df -hto see if you’re close to running out of space -
Free up space:
# Remove completed/failed pods kubectl delete pods --field-selector=status.phase=Succeeded -A kubectl delete pods --field-selector=status.phase=Failed -A # Clean up old pod logs sudo find /var/log/pods -name "*.log" -mtime +7 -delete -
Check where k3s stores data
# Check k3s data directory (usually /var/lib/rancher/k3s) df -h /var/lib/rancher/k3s df -h /var/lib/rancher # Check if it's monitoring a different partition kubectl get nodes -o yaml | grep -A5 -B5 capacity -
Elasticsearch might have just filled up:
root@elastic:/home/elastic# du -sh /var/lib/rancher/k3s/storage/* | sort -hr 39G /var/lib/rancher/k3s/storage/pvc-eafd685f-0d40-486d-95f9-d28717deb8a7_elastic-stack_elasticsearch-data-elasticsearch-es-default-0 37G /var/lib/rancher/k3s/storage/pvc-14305452-f626-4270-81b6-4f4300a17e57_elastic-stack_elasticsearch-data-elasticsearch-es-default-1 102M /var/lib/rancher/k3s/storage/pvc-c338e95d-5052-4d12-9dd5-5120b8d9943d_elastic-stack_logstash-data-logstash-ls-beats-ls-0 - Increase disk space, or delete indices
-
Check that taint is gone after some time:
kubectl get nodes -o custom-columns=NAME:.metadata.name,TAINTS:.spec.taints -
Check Elasticsearch indices
# Port forward to access ES kubectl port-forward svc/elasticsearch-es-http 9200:9200 -n elastic-stack & # Get the password ES_PASSWORD=$(kubectl get secret elasticsearch-es-elastic-user -n elastic-stack -o go-template='') # Check indices by size (largest first) curl -u "elastic:$ES_PASSWORD" -k "https://localhost:9200/_cat/indices?v&s=store.size:desc" # Get detailed breakdown curl -u "elastic:$ES_PASSWORD" -k "https://localhost:9200/_cat/indices?v&h=index,docs.count,store.size,pri.store.size&s=store.size:desc"- In my case, netflow was HUGE
-
Check ILM (Index Lifecycle Management) policies
curl -u "elastic:$ES_PASSWORD" -k "https://localhost:9200/_ilm/policy?pretty" - Use kibana to create a new Netflow policy
- Kibana -> Management -> Index Lifecycle Policies -> Create policy
- Policy name: netflow-ilm-policy
- Hot phase:
- Rollover - do not use recommended defaults
- Max primary shard size: 2GB
- Maximum age: 1 day
- Warm phase:
- Move data into phase when 3 days old
- Set Replicas: 0
- Shrink to 1 shard
- Force merge: 1 segment
- Compress stored fields: true
- Downsample: 15 minutes
- Data allocation: Off
- Cold phase:
- Toggle button “Keep data in this phase forever” to “Delete data after this phase”
- Move data into phase when 7 days old
- Downsample: 1 hour
- Data allocation: Off
- Delete phase
- Move data into phase when 30 days old
- Summary: This policy keeps netflow data in hot for up to 3 days, where it moves it to warm. In warm, it doesn’t replicate any data, compresses the fields, and downsamples the time series data to 15 minute intervals. After 7 days, it moves to cold where it downsamples even further to 1 hour. After 30 days, all netflow data is deleted.
- Apply the new policy to the existing data stream:
- Kibana -> Management -> Index Lifecycle Policies
- Find your new policy, click the Name
- Click Manage ^ Add to index template
- Search for datastream, e.g., netflow, to find the right index template
- Click ‘Add policy’
- Consider adding cold storage sources